|
|

|
A Note on Sources
It is necessary to recognise the problems when dealing with figures for exports and imports. As Miller notes the value of British exports to Latin America increased only 0.2% per annum between 1814 and 1846, while that volume rose by 3.4%. As a result a decrease in the value of exports does not necessarily mean a drying up of trade; indeed it could well mean Latin America became overwhelmed with cheap British imports.[1] Appendix 1 also highlights the problem of looking at the percentage value of exports alone, and how exports can increase, while percentage of total exports decreases. Imlah has also noted that official values (for imports or exports) are calculated from very old prices. Thus Coffee at £3 per kg in 1750 would be measured at a similar rate in 1850, and as a result official calculations often overvalued exports in the aggregate by 120%! Crucially this distorts figures and leads to the (false) assumption of a rise in the value of British exports to match the rise in industry.[2] Furthermore there are issues in looking at financial exports. While company A might invest £x in Indian Tea, and company B invests £x in the Indian tea distributor at home, only company A appears as having a vested interest in empire, when in fact they both do.[3]
Appendix 1. British Exports to Latin America 1804 – 1856 (in £000) Source: Davis, Industrial Revolution, pp.96 – 101 in Miller, Rory Britain and Latin America in the Nineteenth and Twentieth Centuries, Longman, (London 1993), p.73.
Appendix 2. Declared Value of British Exports in £000 Source: GR Porter The Progress of the Nation (London 1912) in Mitchell, B.R., Abstract of British Historical Statistics, Cambridge University Press, (Cambridge, 1962), p.313.
Appendix 3. Proportion of securities on the London Stock Exchange which were government bonds. Source: Ferguson, Niall, The Cash Nexus: Money and Power in the Modern World, 1700 – 2000, Basic Books, (New York, 2000)
Appendix 4. UK rates of savings and investment as a % of GNP, 1830 – 1914 Floud, Roderick and Johnson, Paul (eds.), The Cambridge Economic History of Modern Britain Volume II: Economic Maturity, 1860 – 1939, Cambridge University Press, (Cambridge, 2004), p.193.
Appendix 5. The Distribution of British Investments in Latin America (%) Source: Miller, Rory Britain and Latin America in the Nineteenth and Twentieth Centuries, Longman, (London 1993)
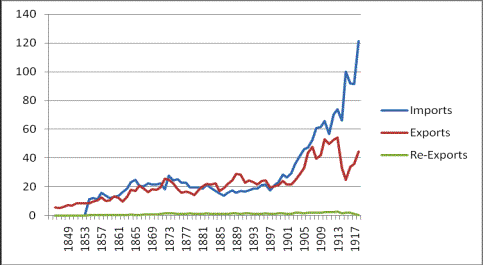
Apppendix 6. Imports, Exports and Re-Exports to Argentina 1846 – 1918 (£million) Source: Mitchell, B.R., Abstract of British Historical Statistics, Cambridge University Press, (Cambridge, 1962), pp.321 – 323.
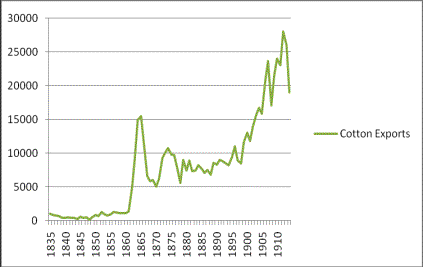
Appendix 7. Egyptian Cotton Exports 1835 – 1914 (Thousand Egyptian Pounds) Source: Mitchell, B.R., International Historical Statistics: Africa, Asia & Oceania 1750 – 2000, Fourth Edition, Palgrave Macmillan, (London, 2003), pp. 637 – 641.
[1] Miller, R., Britain and Latin America in the Nineteenth and Twentieth Centuries, (London 1993), p. 72.
[2] Imlah, A. H., Economic Elements in the Pax Britannica, (Cambridge, Massachusetts, 1958), pp. 20 – 23.
[3] Davis, L. E and Huttenback, R. A, Mammon and the Pursuit of Empire: The Political Economy of British Imperialism, 1860 – 1912, (Cambridge, 1986), pp.33-34.
|
Armed Forces | Art and Culture | Articles | Biographies | Colonies | Discussion | Glossary | Home | Library | Links | Map Room | Sources and Media | Science and Technology | Search | Student Zone | Timelines | TV & Film | Wargames