

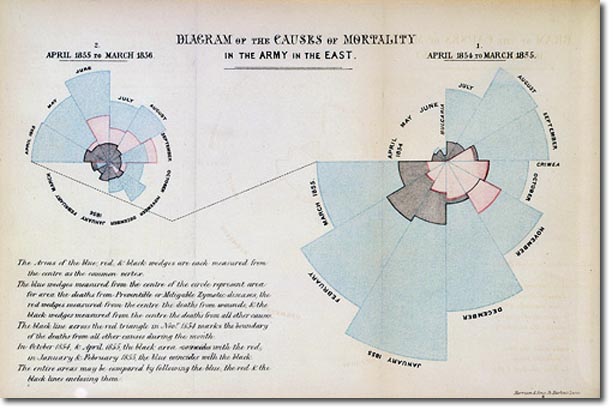
| Florence referred to these charts as Polar Area diagrams. They are in fact one of the first uses of a pie chart. They clearly illustrated that deaths from disease had been drastically reduced after the implementation of her methods and regime. They were presented to the 1857 Royal Commission. |

